# RSoC 2026: A new CPU scheduler for Redox
Table of Contents
TL;DR
I have replaced the legacy Round Robin scheduler with a Deficit Weighted Round Robin scheduler. Due to this, we finally have a way of assigning different priorities to our Process contexts. When running under light load, you may not notice any difference, but under heavy load the new scheduler outperforms the old one (eg. ~150 FPS gain in the pixelcannon 3D Redox demo, and ~1.5x gain in operations/sec for CPU bound tasks and a similar improvement in responsiveness too (measured through schedrs))
What is Redox OS?
Let’s keep this brief, Redox OS is Rust-based microkern-
Redox OS is a complete Unix-like microkernel-based operating system written in Rust, with a focus on security, reliability and safety
Being written in Rust, it gives an inherently higher floor for quality than C in my humble opinion.
Round Robin Scheduler
Redox OS currently uses a simple Round Robin Scheduler.
Imagine you are sitting at a bar with a few of your friends, the bar has all drinks free for tonight, and as a result the bar is understaffed with the number of bartenders significantly less than the customers. The bartenders start from the left, serve the customer, and move to their right.
Some patrons drink slowly and may still have a drink when the bartender returns. As a result, even though not everyone needs a new drink each time, bartenders must still check with them, which introduces inefficiency into the system.
This system works well enough, customers wait for a while, but everybody waits for the same time, and everyone is happy, or atleast equally unhappy.
Unfortunately for these bartenders, a local politician, with quite a short temper and a very large ego, happens to be one of the customers today. If these poor batenders follow their usual protocol and treat the VIP the same as the rest, he will sigterm their employment, but bound by the protocol they have no choice but move in a loop seeing the VIP boil in rage.
In an Operating System, that VIP customer is a high priority I/O bound interactive process (like your audio stack, where even the slightest delay can cause audible artifacts). If it waits in a RR queue behind a CPU-hogging background task. The system feels unresponsive and user sigkills many children in frustration.
Enter..
Deficit Weighted Round Robin Scheduler
Following the debacle at the bar, the offer for free drinks is now over, but the bartenders REALLY like to give free drinks, so they come up with a solution, a stone to kill two birds!
They set up 3 token dispensers, each giving out tokens at different speeds, 1, 2, and 4 tokens per second. 3 queues (A, B, C) form along these dispensers, with a bouncer assigning each customer to a row. The price for a beer has been decided as two tokens, so customer standing in queue A waits two ticks before leaving, while the customer in queue C can afford two beers in just one tick. The customer then leaves the queue and “purchases” the beer!
The problem for VIP’s is solved! As soon as a VIP arrives, the bouncer directs him to queue C, and everybody in the other two queues is put on the backburner.
Unfortunately though, we now have a problem with starvation, as queue C is closer to the exit than B, which is closer than A. If people from all queues have accumulated their balance and want to leave, the customer in C will always be the one to go first. This is a problem! If there are many customers in queue C, the customers from queue A and B will get no chance to purchase beer and will die of starvation!
Deficit Weighted Round Robin Scheduler (DWRR) groups the processes in multiple queues, assigning priority to each queue. At each context switch, it starts with the queue with the highest priority, adds its weight to its balance, and keeps running tasks from it until its balance is below some base price, and then the scheduler moves on to the next queue in the list.
It correctly prioritises the processes with high priority, but can lead to starvation and higher latency for lower priority processes.
Interleaving
To solve the starvation problem without sacrificing the VIPs’ needs, we move to an Interleaved approach. Instead of letting one queue exhaust its entire balance in one go, the scheduler “interleaves” the work.
Think of it as the bartenders serving one round to the VIP queue, then immediately checking if anyone in the lower-priority queues has enough tokens for just one drink, before swinging back to the VIPs.
This results in a slight increase in context-switch overhead, but the latency benefits are undeniable.
Read more about this comparision on wikipedia.
How to set it up?
Scheduler
After setting up Redox OS and ensuring it builds, check out this kernel MR, and the all the related MR’s mentioned in the first comment.
For anyone trying to test it, you have to clone the repos of redox_syscall and libredox (given in the related MRs) into recipes/core/
Your directory should finally look like this:
akshit@laptop-of-doom ~/w/r/r/r/core> lsbase/         binutils/    contain/    dash/        findutils/  ion/     libredox/  netutils/  pkgutils/  redoxfs/        relibc/  userutils/base-initfs/  bootloader/  coreutils/  extrautils/  installer/  kernel/  netdb/     pkgar/     profiled/  redox_syscall/  strace/  uutils/
akshit@laptop-of-doom ~/w/r/r/r/core> pwd/home/akshit/workspace/rust/redox/recipes/core
I have added the patches for Cargo.toml for all the MRs temporarily which will be removed before merging.
Nice & Renice
Checkout this MR, and add renice = {} to your desktop.toml.
You are now setup to try the goodness of the new scheduler!
Usage of nice and renice is quite self-evident.
nice -n -10 pixelcannonrenice -n -5 -p 1234Numbers
For comparing the different schedulers, I built an isolated testing harness. Let’s see their results!
Idealised Workflow
40,000 tasks are initialised at t=0, these tasks are CPU-hogging and never block, their runtime is long enough that they will not finish in our simulation timeframe of 100,000 ticks, and our simulated CPU has 16 cores
-
Round Robin
=== Simulation finished (100000 ticks, 16 cores) ===Tasks spawned : 40000Tasks finished: 0Execute events: 1600000Block events : 0Idle slots : 0Tasks alive : 40000=== Diagnostics ===Absolute CPU Util : 100.00%Scheduler Effic. : 100.00%Forced Idles : 0Wasted Idles : 0Avg Turnaround : N/A (No tasks finished)Avg Wait Time : 99960.00 ticks (All tasks)Max Wait Time : 99960 ticks=== Scheduler Verification ===Avg Response Time : 1249.50 ticks (All tasks)Context Switches : 1599984Ctx Switch Rate : 100.00% of executed ticksAs this is a very idealised workflow, the only important metric to note here is Avg Response Time, as we will see further, the response time for RR is the lowest, but as discussed previously, we have no way of assigning different priorities to our tasks.
-
Deficit Weighted Round Robin
=== Simulation finished (100000 ticks, 16 cores) ===Tasks spawned : 40000Tasks finished: 0Execute events: 1600000Block events : 0Idle slots : 0Tasks alive : 40000=== Diagnostics ===Absolute CPU Util : 100.00%Scheduler Effic. : 100.00%Forced Idles : 0Wasted Idles : 0Avg Turnaround : N/A (No tasks finished)Avg Wait Time : 99960.00 ticks (All tasks)Max Wait Time : 100000 ticks=== Scheduler Verification ===Avg Response Time : 34459.56 ticks (All tasks)Context Switches : 1599984Ctx Switch Rate : 100.00% of executed ticksPrio | Theor. Weight | Avg Execs/Task | Avg Wait/Task | Avg Resp/Task | Samples----------------------------------------------------------------------------------0 | 11 | 0.05 | 99999.95 | 98296.72 | 10001 | 14 | 0.05 | 99999.95 | 97630.59 | 10002 | 18 | 0.08 | 99999.92 | 96717.01 | 10003 | 23 | 0.10 | 99999.90 | 95577.52 | 10004 | 29 | 0.13 | 99999.87 | 94231.06 | 10005 | 36 | 0.16 | 99999.84 | 92651.36 | 10006 | 46 | 0.19 | 99999.81 | 90405.76 | 10007 | 57 | 0.26 | 99999.74 | 87896.05 | 10008 | 72 | 0.32 | 99999.68 | 84514.77 | 10009 | 90 | 0.40 | 99999.60 | 80455.06 | 100010 | 112 | 0.50 | 99999.50 | 75471.92 | 100011 | 140 | 0.62 | 99999.38 | 69147.95 | 100012 | 175 | 0.78 | 99999.22 | 61239.20 | 100013 | 219 | 0.98 | 99999.02 | 51306.77 | 100014 | 274 | 1.23 | 99998.77 | 40981.82 | 100015 | 343 | 1.54 | 99998.46 | 32685.75 | 100016 | 428 | 1.92 | 99998.08 | 26163.02 | 100017 | 535 | 2.40 | 99997.60 | 20889.75 | 100018 | 669 | 3.01 | 99996.99 | 16676.70 | 100019 | 836 | 3.76 | 99996.24 | 13305.07 | 100020 | 1024 | 4.62 | 99995.38 | 10655.50 | 100021 | 1280 | 5.78 | 99994.22 | 8591.62 | 100022 | 1600 | 7.22 | 99992.78 | 6861.10 | 100023 | 2000 | 9.02 | 99990.98 | 5469.71 | 100024 | 2500 | 11.28 | 99988.72 | 4331.65 | 100025 | 3125 | 14.10 | 99985.90 | 3432.66 | 100026 | 3906 | 17.63 | 99982.37 | 2714.61 | 100027 | 4882 | 22.03 | 99977.97 | 2144.54 | 100028 | 6103 | 27.55 | 99972.45 | 1703.30 | 100029 | 7629 | 34.45 | 99965.55 | 1327.54 | 100030 | 9536 | 43.06 | 99956.94 | 1042.08 | 100031 | 11920 | 53.82 | 99946.18 | 817.14 | 100032 | 14901 | 67.28 | 99932.72 | 639.05 | 100033 | 18626 | 84.10 | 99915.90 | 507.95 | 100034 | 23283 | 104.80 | 99895.20 | 408.92 | 100035 | 29103 | 130.96 | 99869.04 | 340.15 | 100036 | 36379 | 163.70 | 99836.30 | 296.71 | 100037 | 45474 | 204.62 | 99795.38 | 284.85 | 100038 | 56843 | 255.79 | 99744.21 | 274.55 | 100039 | 71053 | 319.73 | 99680.27 | 294.75 | 1000Let’s clarify the columns first- a. Prio - The Priority of the task b. Theor. Weight - Its Theoretical Weight. c. Avg Execs/Task - How many times on average, a task in this priority queue was executed (Should be higher for higher priorities) d. Avg Wait/Task - How much time a task spends sitting in the runqueue waiting for a CPU to pick it up. (It is nearly same for the idealised workflows because of the sheer number of tasks vs only 16 cores) e. Avg Resp/Task - The time from when a task first arrives to the very first time it gets to execute on the CPU. f. Samples - Number of tasks in this priority queue.
As can be seen, the avg response time has shot up from 1249 to 34459, a 27x increase! But the story changes when we look at Avg Execs/Task and Avg Resp/Task, a task with prio 39 has seen a significant increase in its execs, and decrease in its Resp. time!
Though, we can notice the plight of the lower priority tasks and their starvation.
-
Interleaved DWRR
=== Simulation finished (100000 ticks, 16 cores) ===Tasks spawned : 40000Tasks finished: 0Execute events: 1600000Block events : 0Idle slots : 0Tasks alive : 40000=== Diagnostics ===Absolute CPU Util : 100.00%Scheduler Effic. : 100.00%Forced Idles : 0Wasted Idles : 0Avg Turnaround : N/A (No tasks finished)Avg Wait Time : 99960.00 ticks (All tasks)Max Wait Time : 100000 ticks=== Scheduler Verification ===Avg Response Time : 7442.54 ticks (All tasks)Context Switches : 1599984Ctx Switch Rate : 100.00% of executed ticksPrio | Theor. Weight | Avg Execs/Task | Avg Wait/Task | Avg Resp/Task | Samples----------------------------------------------------------------------------------0 | 11 | 0.86 | 99999.14 | 57294.02 | 10001 | 14 | 1.10 | 99998.90 | 45990.23 | 10002 | 18 | 1.41 | 99998.59 | 35901.44 | 10003 | 23 | 1.79 | 99998.21 | 28225.50 | 10004 | 29 | 2.24 | 99997.76 | 22508.50 | 10005 | 36 | 2.77 | 99997.23 | 18245.71 | 10006 | 46 | 3.50 | 99996.50 | 14408.67 | 10007 | 57 | 4.30 | 99995.70 | 11741.59 | 10008 | 72 | 5.38 | 99994.62 | 9418.16 | 10009 | 90 | 6.61 | 99993.39 | 7653.62 | 100010 | 112 | 8.06 | 99991.94 | 6265.28 | 100011 | 140 | 9.84 | 99990.16 | 5131.14 | 100012 | 175 | 11.94 | 99988.06 | 4223.29 | 100013 | 219 | 14.42 | 99985.58 | 3494.20 | 100014 | 274 | 17.28 | 99982.72 | 2911.74 | 100015 | 343 | 20.53 | 99979.47 | 2444.05 | 100016 | 428 | 24.13 | 99975.87 | 2077.24 | 100017 | 535 | 28.08 | 99971.92 | 1780.25 | 100018 | 669 | 32.35 | 99967.65 | 1543.24 | 100019 | 836 | 36.78 | 99963.22 | 1353.78 | 100020 | 1024 | 40.93 | 99959.07 | 1205.02 | 100021 | 1280 | 45.47 | 99954.53 | 1089.07 | 100022 | 1600 | 49.92 | 99950.08 | 991.85 | 100023 | 2000 | 54.14 | 99945.86 | 914.02 | 100024 | 2500 | 58.08 | 99941.92 | 850.26 | 100025 | 3125 | 61.66 | 99938.34 | 800.43 | 100026 | 3906 | 64.86 | 99935.14 | 760.65 | 100027 | 4882 | 67.65 | 99932.35 | 728.98 | 100028 | 6103 | 70.08 | 99929.92 | 704.68 | 100029 | 7629 | 72.16 | 99927.84 | 684.01 | 100030 | 9536 | 73.90 | 99926.10 | 668.34 | 100031 | 11920 | 75.38 | 99924.62 | 655.91 | 100032 | 14901 | 76.59 | 99923.41 | 646.07 | 100033 | 18626 | 77.58 | 99922.42 | 638.79 | 100034 | 23283 | 78.40 | 99921.60 | 632.95 | 100035 | 29103 | 79.07 | 99920.93 | 628.70 | 100036 | 36379 | 79.60 | 99920.40 | 625.49 | 100037 | 45474 | 80.05 | 99919.95 | 623.61 | 100038 | 56843 | 80.40 | 99919.60 | 621.18 | 100039 | 71053 | 80.69 | 99919.31 | 619.84 | 1000The avg response time is significantly less than the non-interleaved one, but on the other hand Avg Execs/Task are no longer as extreme as DWRR. The difference in Execs in any two adjacent priorities is now quite small, especially at the extremes.
As can be seen the interleaved scheduler is a lot more fair while still giving us a method to prioritise some tasks.
Randomised Tasks
This time, at each time step, we have a chance to generate upto 1 new task for each core. This new task has a random total runtime (range 2..100000) and they have a attribute called blocking chance (range 0..0.001) which dictates how likely the task is to block at each time step it is executed.
for _ in 0..self.cores.len() { if self.rng.random_bool(self.new_task_chance) { // new_task_chance = 0.001 news.push(self.scheduler.new_task( self.last_pid, self.current_time, self.rng.random_range(2..100000), // runtime self.rng.random_range(0.0..0.001f64), // blocking chance )); self.last_pid += 1; }}-
Round Robin
=== Simulation finished (100000 ticks, 16 cores) ===Tasks spawned : 1694Tasks finished: 18Execute events: 1593554Block events : 795Idle slots : 6446Tasks alive : 1676=== Diagnostics ===Absolute CPU Util : 99.60%Scheduler Effic. : 99.64%Forced Idles : 720Wasted Idles : 5726Avg Turnaround : 23976.50 ticks (Completed tasks only)Avg Wait Time : 48120.16 ticks (All tasks)Max Wait Time : 94245 ticks=== Scheduler Verification ===Avg Response Time : 51.85 ticks (All tasks)Context Switches : 1584937Ctx Switch Rate : 99.46% of executed ticksAgain, we will compare the avg response time.
-
DWRR
=== Simulation finished (100000 ticks, 16 cores) ===Tasks spawned : 1675Tasks finished: 19Execute events: 1593758Block events : 785Idle slots : 6242Tasks alive : 1656=== Diagnostics ===Absolute CPU Util : 99.61%Scheduler Effic. : 99.65%Forced Idles : 720Wasted Idles : 5522Avg Turnaround : 28837.89 ticks (Completed tasks only)Avg Wait Time : 48501.35 ticks (All tasks)Max Wait Time : 98986 ticks=== Scheduler Verification ===Avg Response Time : 3572.60 ticks (All tasks)Context Switches : 1513098Ctx Switch Rate : 94.94% of executed ticksPrio | Theor. Weight | Avg Execs/Task | Avg Wait/Task | Avg Resp/Task | Samples----------------------------------------------------------------------------------0 | 11 | 24.21 | 50892.05 | 23183.64 | 421 | 14 | 24.19 | 50822.86 | 20124.14 | 422 | 18 | 24.45 | 50754.79 | 16988.43 | 423 | 23 | 26.07 | 50705.07 | 14319.05 | 424 | 29 | 26.50 | 50643.31 | 12152.24 | 425 | 36 | 28.05 | 50581.81 | 10211.95 | 426 | 46 | 28.52 | 50528.93 | 8212.40 | 427 | 57 | 30.79 | 50473.64 | 6936.67 | 428 | 72 | 32.64 | 50403.57 | 5629.48 | 429 | 90 | 35.24 | 50358.76 | 4683.40 | 4210 | 112 | 38.36 | 50298.83 | 3792.81 | 4211 | 140 | 39.88 | 50238.76 | 3216.88 | 4212 | 175 | 45.74 | 50184.26 | 2574.95 | 4213 | 219 | 50.10 | 50117.07 | 2055.76 | 4214 | 274 | 58.02 | 50045.31 | 1656.71 | 4215 | 343 | 66.71 | 49986.55 | 1335.38 | 4216 | 428 | 76.60 | 49901.86 | 1048.12 | 4217 | 535 | 89.17 | 49825.38 | 861.93 | 4218 | 669 | 105.76 | 49743.50 | 693.57 | 4219 | 836 | 126.05 | 49669.76 | 556.07 | 4220 | 1024 | 148.60 | 49592.67 | 449.21 | 4221 | 1280 | 177.10 | 49502.98 | 359.67 | 4222 | 1600 | 215.60 | 49407.50 | 285.60 | 4223 | 2000 | 260.86 | 49303.71 | 232.95 | 4224 | 2500 | 315.62 | 49187.90 | 187.12 | 4225 | 3125 | 384.62 | 48405.21 | 146.33 | 4226 | 3906 | 470.67 | 48924.67 | 116.45 | 4227 | 4882 | 577.90 | 47528.00 | 95.79 | 4228 | 6103 | 710.60 | 48586.55 | 79.24 | 4229 | 7629 | 873.36 | 48359.79 | 60.71 | 4230 | 9536 | 1074.52 | 47464.40 | 47.31 | 4231 | 11920 | 1325.69 | 47796.31 | 42.40 | 4232 | 14901 | 1628.88 | 47406.24 | 32.21 | 4233 | 18626 | 2015.14 | 46700.14 | 25.55 | 4234 | 23283 | 2485.21 | 46150.69 | 20.00 | 4235 | 29103 | 3149.07 | 44751.83 | 19.80 | 4136 | 36379 | 3885.54 | 44196.22 | 16.49 | 4137 | 45474 | 4800.20 | 44096.80 | 13.46 | 4138 | 56843 | 5937.27 | 39151.80 | 10.27 | 4139 | 71053 | 7125.95 | 36560.95 | 6.15 | 41As we can see once again, the higher priority tasks see a very significant improvement in their stats, while the lowest priorities see a significant decrease.
-
Interleaved DWRR
=== Simulation finished (100000 ticks, 16 cores) ===Tasks spawned : 1694Tasks finished: 17Execute events: 1594185Block events : 771Idle slots : 5815Tasks alive : 1677=== Diagnostics ===Absolute CPU Util : 99.64%Scheduler Effic. : 99.68%Forced Idles : 720Wasted Idles : 5095Avg Turnaround : 19845.41 ticks (Completed tasks only)Avg Wait Time : 47730.81 ticks (All tasks)Max Wait Time : 99029 ticks=== Scheduler Verification ===Avg Response Time : 309.42 ticks (All tasks)Context Switches : 1593932Ctx Switch Rate : 99.98% of executed ticksPrio | Theor. Weight | Avg Execs/Task | Avg Wait/Task | Avg Resp/Task | Samples----------------------------------------------------------------------------------0 | 11 | 39.14 | 49599.84 | 2327.05 | 431 | 14 | 44.56 | 49524.23 | 1883.81 | 432 | 18 | 51.70 | 49457.37 | 1465.60 | 433 | 23 | 61.65 | 49391.60 | 1174.26 | 434 | 29 | 71.91 | 49323.74 | 907.98 | 435 | 36 | 84.74 | 49256.72 | 753.70 | 436 | 46 | 101.40 | 49188.16 | 596.65 | 437 | 57 | 120.81 | 49112.67 | 473.23 | 438 | 72 | 145.35 | 49035.26 | 394.09 | 439 | 90 | 174.26 | 48950.81 | 320.21 | 4310 | 112 | 208.19 | 48839.07 | 264.07 | 4311 | 140 | 249.74 | 48728.21 | 213.07 | 4312 | 175 | 298.33 | 48601.60 | 172.63 | 4313 | 219 | 355.44 | 48484.21 | 143.51 | 4314 | 274 | 431.48 | 49508.79 | 122.57 | 4215 | 343 | 508.14 | 49374.55 | 102.98 | 4216 | 428 | 592.57 | 49240.57 | 87.62 | 4217 | 535 | 684.57 | 49090.19 | 74.33 | 4218 | 669 | 783.95 | 47656.31 | 62.60 | 4219 | 836 | 887.79 | 48761.90 | 56.00 | 4220 | 1024 | 980.93 | 48604.95 | 51.57 | 4221 | 1280 | 1087.26 | 48440.60 | 46.36 | 4222 | 1600 | 1190.40 | 46318.52 | 39.00 | 4223 | 2000 | 1285.60 | 47352.98 | 37.43 | 4224 | 2500 | 1374.31 | 47994.64 | 36.07 | 4225 | 3125 | 1454.71 | 47553.24 | 33.88 | 4226 | 3906 | 1527.64 | 47717.24 | 30.07 | 4227 | 4882 | 1590.74 | 47598.86 | 31.10 | 4228 | 6103 | 1643.95 | 47484.29 | 29.93 | 4229 | 7629 | 1690.29 | 45980.26 | 27.60 | 4230 | 9536 | 1728.45 | 47283.40 | 27.79 | 4231 | 11920 | 1761.95 | 45358.05 | 25.98 | 4232 | 14901 | 1789.07 | 44462.19 | 26.17 | 4233 | 18626 | 1803.95 | 47015.21 | 27.26 | 4234 | 23283 | 1821.83 | 44388.64 | 24.98 | 4235 | 29103 | 1837.10 | 43475.88 | 24.14 | 4236 | 36379 | 1848.98 | 44444.36 | 24.48 | 4237 | 45474 | 1858.00 | 44644.26 | 24.55 | 4238 | 56843 | 1866.29 | 44897.07 | 25.55 | 4239 | 71053 | 1871.83 | 46633.38 | 26.17 | 42The Avg Response Time is now 11x lower than standard DWRR while the highes priority queues have gone from 6 ticks to 26 in response time. Avg Execs show do show a large reduction for higher priorities from ~7000 ticks to ~1800 ticks.
I think I have convinced you by this point that interleaved DWRR is a good middle ground between the fairness of the simple RR and the performance in DWRR (for high priority tasks)!
Real World Workflow
-
pixelcannon
The current simple Round Robin gives ~1000 FPS with two CPU hogging (`while true; do :; done` in bash, or `while (1) printf(“Hello!\n”);` in C) programs running in the background.
On the other hand, the new scheduler with 0 prio for all, gives ~1000 FPS too with some margin of error.
If we increase the priority (decrease niceness) of pixelcannon and decrease the priority of the two CPU hogging applications, pixelcannon now delivers ~1150 FPS!
-
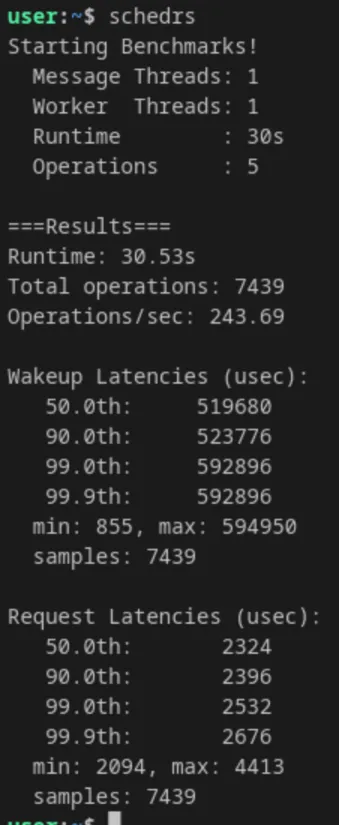
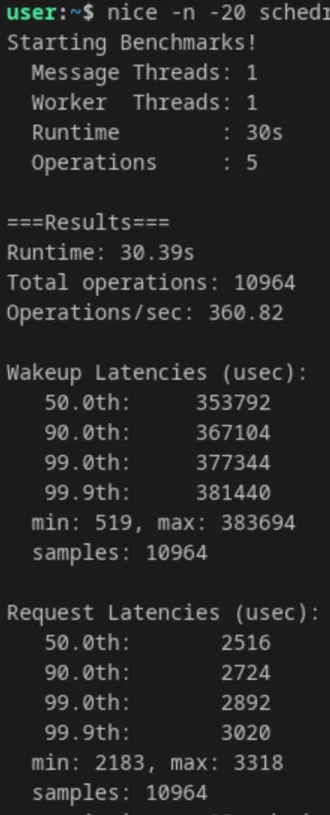
Schedrs
This is my rust rewrite of schbench. As expected this is the area the new scheduler particularly shines in. To replicate my results, just run two CPU hogging programs, and then run schedrs
-
RR
-
DWRR
-
Verdict
While the simulator showed us the theoretical limits, the real-world tests prove the architecture works as intended under contention.
By running two aggressive background `while(true)` CPU hogs, we forced the system into a high-contention state, allowing us to compare behaviour under load:
- Interactive Workloads (pixelcannon): By `renice`-ing pixelcannon to a higher priority, boosting framerates from ~1000 FPS to ~1150 FPS (a 15% gain in interactive responsiveness).
- Context-Switch Latency (Schedrs): The most dramatic improvement was in pure scheduling overhead. Ops/sec jumped from 243 to 360 (a 48% increase), and median wakeup latencies dropped massively.
The DWRR scheduler successfully protects high-priority and latency-sensitive tasks from being starved by background noise.
Next up: replacing the static queue logic with the dynamic lag-calculations of full EEVDF!